

Contra Costa Property Assessment Appeals Due November 30
Homeowners who believe their property was overvalued as of January 1, 2026, can request a free county review or file a formal…
7 min read
San Francisco housing market
Updated Sept. 3, 2026 · Data: Redfin · 3 months ending Aug. 31, 2026 · San Francisco, CA
$1,591,447Median sale price, 3 months ending Aug. 31, 2026
Updated Sept. 3, 2026 · Data: Redfin · San Francisco, CA · Each point is a rolling three-month period, placed at its last month.
| Period | Median sale price |
|---|---|
| 3 months ending Aug. 31, 2026 | $1,591,447 |
| 3 months ending July 31, 2026 | $1,671,000 |
| 3 months ending June 30, 2026 | $1,700,000 |
| 3 months ending May 31, 2026 | $1,700,000 |
| 3 months ending April 30, 2026 | $1,636,500 |
| 3 months ending March 31, 2026 | $1,530,000 |
| 3 months ending Feb. 28, 2026 | $1,400,000 |
| 3 months ending Jan. 31, 2026 | $1,400,000 |
| 3 months ending Dec. 31, 2025 | $1,450,000 |
| 3 months ending Nov. 30, 2025 | $1,450,000 |
| 3 months ending Oct. 31, 2025 | $1,400,000 |
| 3 months ending Sept. 30, 2025 | $1,375,000 |
| 3 months ending Aug. 31, 2025 | $1,400,000 |
| 3 months ending July 31, 2025 | $1,467,000 |
| 3 months ending June 30, 2025 | $1,481,000 |
| 3 months ending May 31, 2025 | $1,465,000 |
| 3 months ending April 30, 2025 | $1,419,000 |
| 3 months ending March 31, 2025 | $1,380,000 |
| 3 months ending Feb. 28, 2025 | $1,350,000 |
| 3 months ending Jan. 31, 2025 | $1,350,000 |
| 3 months ending Dec. 31, 2024 | $1,425,000 |
| 3 months ending Nov. 30, 2024 | $1,425,000 |
| 3 months ending Oct. 31, 2024 | $1,407,500 |
| 3 months ending Sept. 30, 2024 | $1,355,000 |
Updated Sept. 16, 2026 · Data: Zillow Research · August 2026 · San Francisco, CA
Homeowners who believe their property was overvalued as of January 1, 2026, can request a free county review or file a formal…
7 min read

Caltrain recorded more than 350,000 rides to Giants, 49ers, Valkyries, and Bay FC games between July and September 2026—including…
4 min read

San Francisco Mayor Daniel Lurie's administration dismissed 6 of the 10 staff members in the Mayor's Office of Innovation—an office…
6 min read

San Francisco voters split two major fiscal ballot measures, approving Proposition B by 52.3% (164,430 to 149,904 votes) to establish…
6 min read

The San Francisco Planning Department granted final approval on November 6, 2026, to Align Real Estate's proposal at 15 Marina…
4 min read

Florida-based 1754 Properties purchased the six-floor Google-occupied building at 40 Jessie St. in San Francisco for nearly $28…
5 min read

The upper Cole Valley residence across from Sutro Forest where Gov.
2 min read

San Francisco officials and real estate brokers say Anthropic’s initial public offering—which Chief Economist Ted Egan notes could…
3 min read

The Mountain View City Council unanimously extended LinkedIn’s development timeline by five years to February 2034 for two six-story…
2 min read
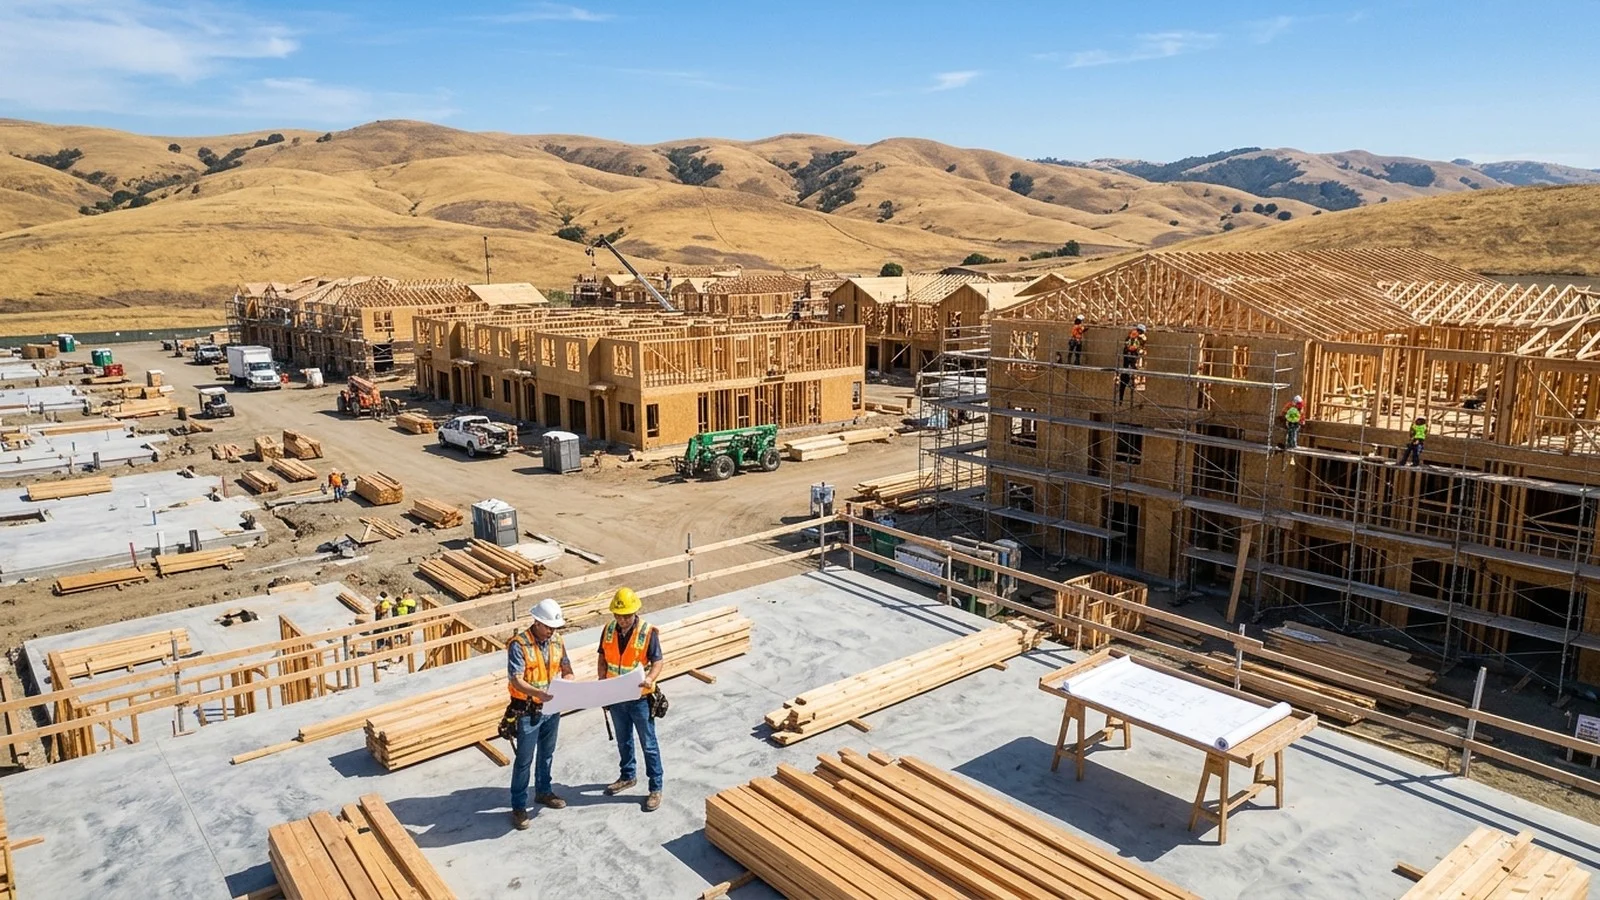
State housing director Gustavo Velasquez told the Little Hoover Commission that more than 692,000 homes have been built in California…
2 min read

City Community Development Department opens application window for deed-restricted downtown condominium residences
2 min read

Zumper index highlights competitive median rents alongside growing transit-oriented residential development near BART
2 min read